
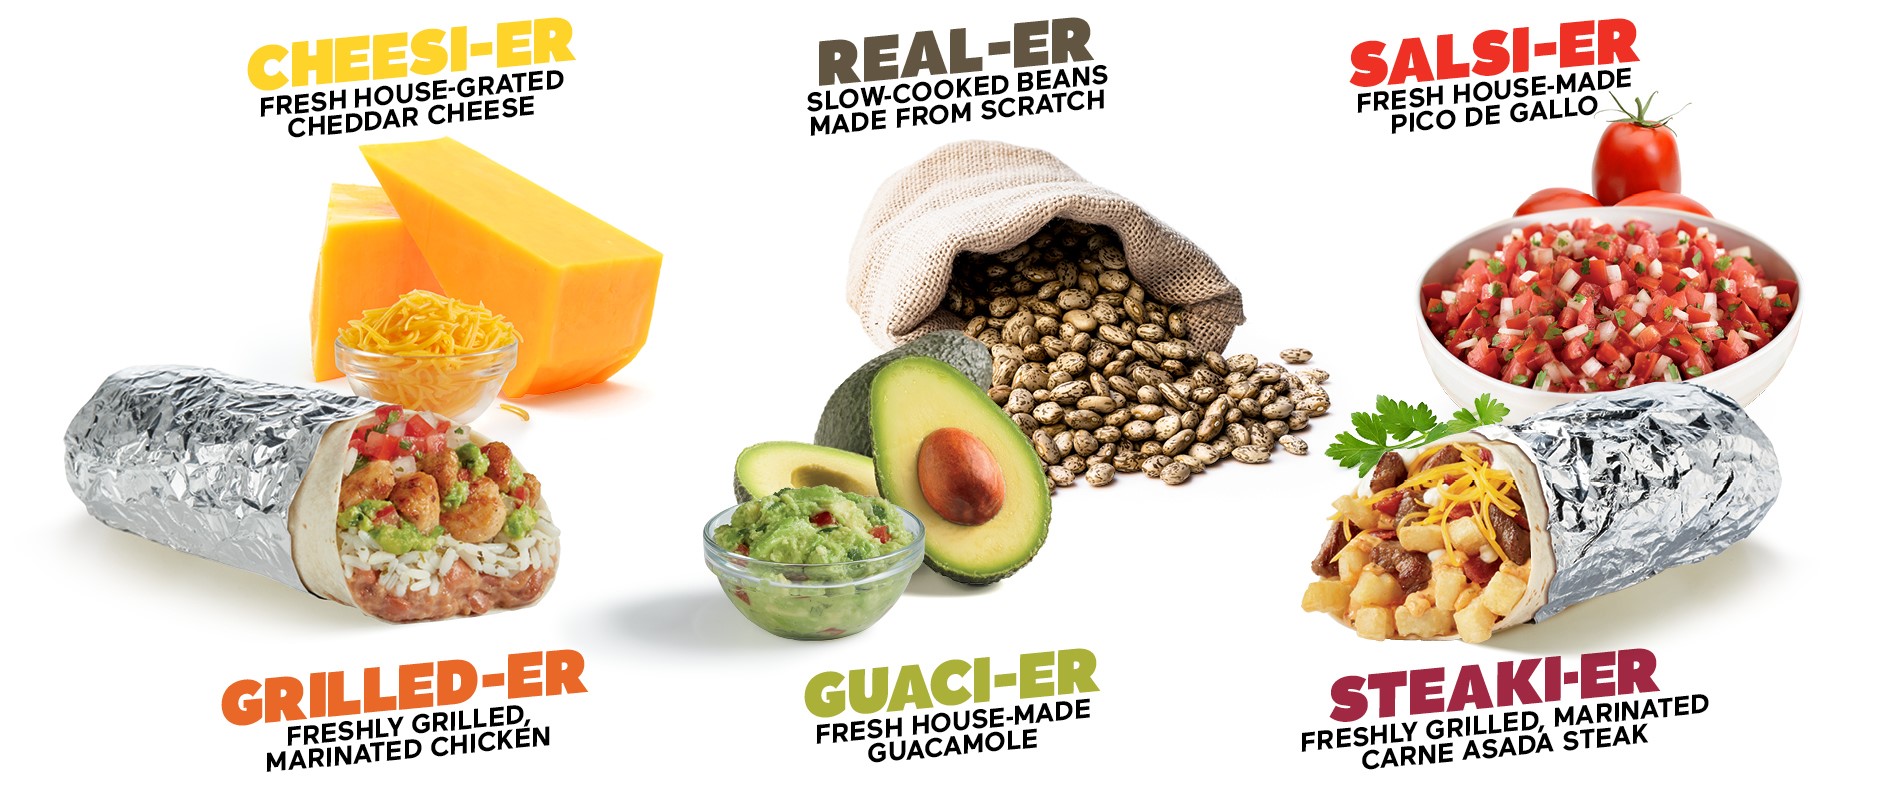
Fresh Ingredients
Fresh tastes better. Our menu starts and ends with fresh ingredients.


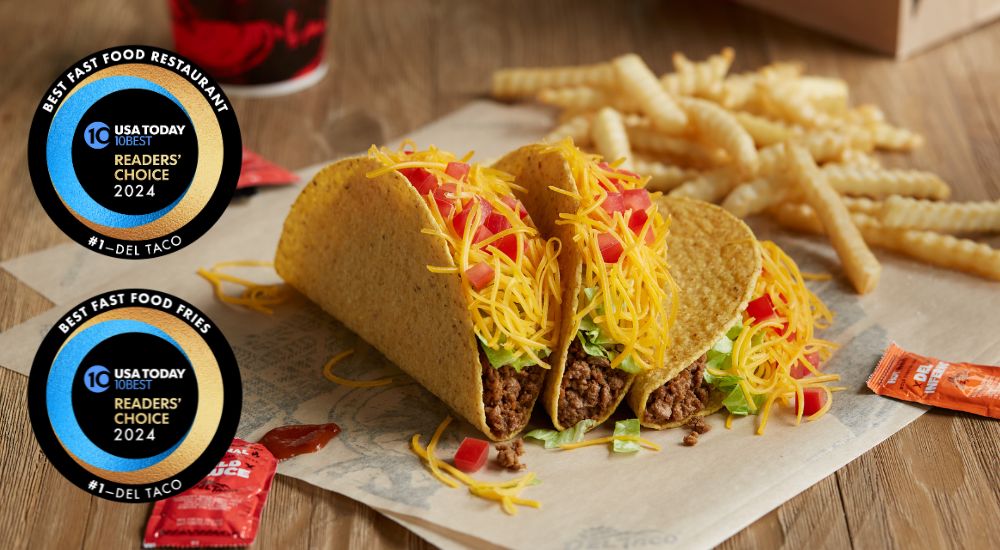
The results are in for the USA TODAY 10Best Readers' Choice Awards! Del Taco won in two categories including BEST Fast Food Restaurant & BEST Fast Food Fries! Thank you to all of our loyal guests. We truly are so honored.
Ready to join our award-winning franchise? Let's get started!
Fresh tastes better. Our menu starts and ends with fresh ingredients.
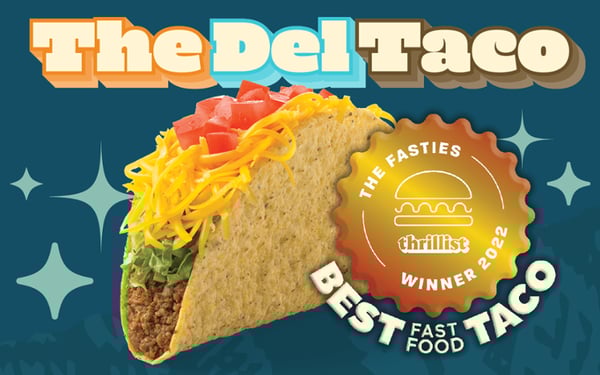
The Del Taco was named the Best Fast Food Taco by Thrillist.
We are the second largest Mexican QSR concept in the United States.*
9 consecutive years of Total Franchise Same Stores Sales Growth*
Proven performance and demand in new markets supported with an omni channel marketing approach.
Take advantage of an opportunity to grow your wealth with a QSR brand on the rise.
Positioned for continual growth with a compelling QSR+ proposition that resonates with consumers.
Franchisees receive initial and ongoing training from our seasoned staff members.
For more than 60 years, Del Taco has been serving freshly prepared, craveable food at an unbeatable value. This rare combination is one of the many reasons that we are one of the leading brands in the fast-growing Mexican quick-service restaurant (QSR) category.

Del Taco offers an enhanced franchise growth incentive program for multi-unit operators interested in expanding their portfolio with a winning brand.

Available Markets
Future Growth Opportunity
Sold Out


We are looking for a special kind of franchisee — one who wants to be part of our iconic brand and invest in growth! The ideal candidate or investment group will:

Del Taco occupies the space between a traditional QSR and a Fast Casual atmosphere, by offering delicious quality food, prepared with fresh ingredients, and served with the value and convenience of a drive-thru. We're at the forefront of the QSR+ category.
Guests love Del Taco's Mexican-inspired favorites and American classics, prepared with fresh ingredients, hand-chopped, slow-cooked, and grilled in each restaurant's working kitchen. As much as our customers love our food, they also appreciate the convenience our restaurants and drive-thru lanes provide for their busy lives.

Our franchise partners enjoy the benefits of customized marketing plans designed to support successful restaurant openings and maintain awareness.


"With strong year-over-year store sales growth, our group believes we are not even close to the number of locations we can own and operate."

"Del Taco's Leadership Team is incredibly strong. They're guided by data-driven decisions that have measurable results for the brand."

"I only wish I had become a franchisee sooner. There's never been a better time to be a part of this brand."